Chapter 10: More graphics
10.1. curves
We have seen how you can use the <lines> tag to create a
number of straight lines with one command. Not all the lines you want to draw will be straight,
which is why we have the <curves> tag.
Like <lines>, <curves> must appear in the
<pageGraphics> section of your <template>.
Unlike <lines>, you need to specify 4 points as X-Y co-ordinate pairs (i.e. you need to feed
<curves> sequences of 8 numbers at a time, rather than the 4 you need for
lines).
The <curves> tag produces a Bézier curve.
Bézier curves are named after the French mathematician, Pierre Bézier, and are curves that
utilize at least three points to define a curve. RML curves use the two endpoints (or "anchor
points") and two "nodes".

Figure 17: A Bézier Curve
In RML, if you give a curve 4 control points (which we shall call (x1,y1), (x2,y2), (x3,y3), and (x4, y4)), the start point of the curve will be specified by (x1,y1) and the endpoint specified by (x4,y4). The line segment from (x1,y1) to (x2,y2) forms a tangent to the curve. The line segment from (x3,y3) to (x4,y4) also forms a tangent to the curve. If you look at an illustration of a Bézier curve, you will see that the curve is entirely contained within the convex figure with its vertices at the control points.
Example:
<template>
  <pageTemplate id="main">
    <pageGraphics>
      <curves>
        198 560
        198 280
        396 280
        396 560
      </curves>
    </pageGraphics>
    <frame id="first" x1="0.5in" y1="0.5in" width="20cm" height="28cm"/>
  </pageTemplate>
</template>
10.2. paths
To connect lines and curves you need to use the <path> tag. This allows you to
make complex figures.
Like the other graphics in RML, <path> lives in the <pageGraphics>
section at the start of the document.
Initially, you must give a <path> tag x and y attributes to tell it the co-ordinates for the point
where this path is going to start. You may also at the same time give it attributes called stroke and
fill (which do the same as their counterparts for the basic shapes such as
<rect> and <circle>), and an additional one
called close. If the close attribute is set to "yes" or "1", then once the <path> is completed,
the stroke is finished off by painting a line from the last point given to the first point, enclosing the
figure.
You may specify attribute autoclose to be one of the values: none, pdf or svg; these values alter
how automatic closing of sub-paths is handled. The default none just leaves the renderer to handle
filling as does pdf, but in the latter case all-subpaths are forced to be closed if fillis set. The
last value svg fills and strokes separately (stroke last).
Finally you can control how filling of complex shapes is handled by specifying attribute
fillrule to be one of the values: none, even-odd or non-zero. The default none means let the
pdf canvas decide, but that is currently equivalent to even-odd. For further information on fill rules
consult a graphics primer.
The <path> tag has its paired </path> tag. Between these two tags, you can have a number of things:
- You can have a list of pairs of X-Y co-ordinates. If this is the case, a straight line is drawn to each point in turn.
- You can have a paired
<moveto></moveto>tag. If this is the case, you need to give an x-y co-ordinate pair between these two tags. The "pen" or "brush" then moves to this point, and any further points or instructions given after this (while still inside the<path>tag) continue onwards from this new point. - You can have a paired
<curvesto></curvesto>tag. This is similar to both the<curves>tag and the<moveto>tag discussed above. Inside the pair of<curvesto>tags, you need to give rml2pdf sets of 3 pairs of X-Y co-ordinates at a time. Like<curves>,<curvesto>creates a Bézier curve. However, since it is inside apathobject, it already knows one of the points - the start point is assumed to be the last point in the path before the<curvesto>tag. In other words, the "pen" or "brush" is already in a position, and this is taken as the first point for your Bézier curve. - You can have a
<closePath/>tag. This will close the current sub-path; this tag must be followed by a<moveto>tag or the end of the<path>.
Here is an example of how a <path> looks in action:
EXAMPLE 14
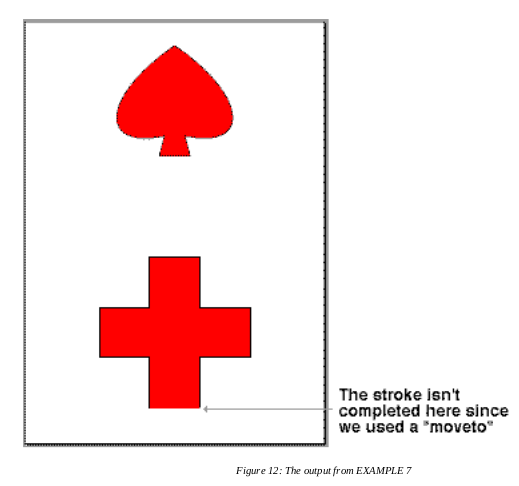
Figure 17: Output from EXAMPLE 14a
<?xml version="1.0" encoding="iso-8859-1" standalone="no" ?>
<!DOCTYPE document SYSTEM "rml.dtd">
<document filename="example_7a.pdf">

    <template>
        <pageTemplate id="main">
            <pageGraphics>
                <fill color="red"/>
                <stroke color="black"/>
                <path x="247" y="72" fill="yes" stroke="yes" close="yes">
                    247 172
                    147 172
                    147 272
                    247 272
                    247 372
                    347 372
                    347 372
                    347 272
                    447 272
                    447 172
                    347 172
                    347 72
                    <!-- This completes the first shape: a red cross.-->
                    <moveto>267 572</moveto>
                    <!-- This moves the "pen position"                              -->
                    <!-- Notice that because we have used a "moveto", the           -->
                    <!-- final line at the base of the cross is not completed, even -->
                    <!-- though the "close" attribute of the "path" tag is set to   -->
                    <!-- "yes"                                                      -->
                    277 612
                    <!-- this acts as the start point for the Bézier curves below   -->

                    <curvesto>
                        147 585
                        147 687
                        297 792

                        447 687 447 585 317 612
                    </curvesto>
                    327 572
                    <!-- We don't need to give the last point because close is -->
                    <!-- set to "yes"                                          -->
                </path>
            </pageGraphics>
            <frame id="first" x1="72" y1="72" width="451" height="698"/>
        </pageTemplate>
    </template>

    <stylesheet>
    </stylesheet>

    <story>
        <para></para>
    </story>

</document>
<?xml version="1.0" encoding="iso-8859-1" standalone="no" ?>
<!DOCTYPE document SYSTEM "rml.dtd">
<document filename="example_7b.pdf">

    <stylesheet>
    </stylesheet>

    <pageDrawing>
        <fill color="red"/>
        <stroke color="black"/>
        <path x="247" y="72" fill="yes" stroke="yes" close="yes">
            247 172
            147 172
            147 272
            247 272
            247 372
            347 372
            347 372
            347 272
            447 272
            447 172
            347 172
            347 72
            <moveto>267 572</moveto>
            277 612
            <curvesto>
                147 585 147 687 297 792
                447 687 447 585 317 612
            </curvesto>
            327 572
        </path>
    </pageDrawing>

</document>
The 14a example has used the
template/stylesheet/story
form of document. But the story is empty, and we haven't used the stylesheet at all. The 14b example shows
how we can use the <pageDrawing> form.
10.3. grids
The <grid> is a graphics tag, and hence lives in the
<pageGraphics> section of your RML document. It produces a grid of lines.
It takes two arguments - xs which is a list of x co-ordinates (separated by commas), and ys which is a
comma-separated list of y co-ordinates.
Example:
10.4. Translations
In a graphic operation (i.e. a pageGraphic or an
illustration),
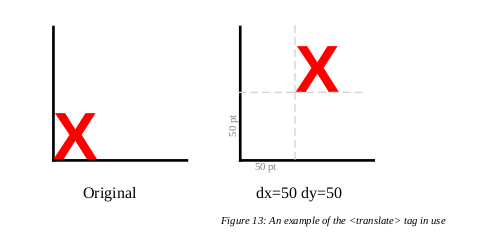
<translate> moves the origin of the drawing.
<translate> takes two optional attributes: dx and dy. Both can be given in any unit that RML understands.
dx is the distance that the to be moved in the X axis, and dy is the distance it is to be moved in the Y axis.
They are optional to allow you to only give one of the pair - so moving the origin in only one direction.
Examples:
This is what a translation with a dx of 50 and a dy of 50 looks like:
And this is slightly simplified version of the relevant bit of RML:
<illustration>
    <lines>
        16 40 116 40
        16 40 16 140

        156 40 256 40
        156 40 156 140
    </lines>
    <setFont name="Times-Roman" size="12"/>
    <fill color="black"/>
    <drawCentredString x="58" y="12">Original</drawCentredString>

    <setFont name="Helvetica-Bold" size="50"/>
    <fill color="red"/>
    <drawString x="16" y="41">X</drawString>
    <translate dx="142"/>

    <setFont name="Times-Roman" size="8"/>
    <fill color="lightgray"/>
    <drawCentredString x="58" y="18">50 pt</drawCentredString>

    <setFont name="Times-Roman" size="12"/>
    <fill color="black"/>
    <drawCentredString x="58" y="12">dx=50 dy=50</drawCentredString>
    <!-- This is relative to the origin of the black lines in the illustration,
         which is why it doesn't match the actual translate performed:
         it is what the translate would be if the origin was at 15,40  -->

    <setFont name="Helvetica-Bold" size="50"/>
    <fill color="red"/>
    <translate dx="55" dy="91"/>
    <drawString x="0" y="0">X</drawString>

</illustration>
10.5. scaling
<scale>, as its name suggests, allows you to stretch or shrink a graphic.
The scale tag takes two optional attributes: sx and sy. sx is how much to scale the X axis, and
sy is how much to scale the Y axis. The scaling does not have to be proportional - omitting one allows
you to change the scaling in one direction only. And you can shrink the shape as well as scale it up - an
sx or sy of "2" doubles the size of it, but an sx or sy of "0.5" halves it.
Scale factors can also be negative. Using an sx of -1 and an sy of 1
produces a mirror image.
Examples:
This is what a scale with a sx of 2 and an sy of 2 looks like:
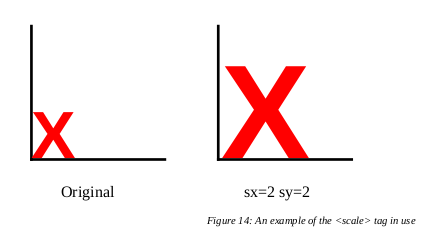
Figure 19: An example of the <scale> tag in use
10.6. rotations
The <rotate> tag allows allows you to rotate a graphic.
<rotate> takes one mandatory attributes called degrees, which is the number of degrees to rotate the object.
A positive number for degrees rotates it anti-clockwise, a negative number rotates it clockwise.
When using <rotate>, objects are rotated around the current origin. If you want to rotate a
specific element of a <pageGraphic> or
<illustration>, you will have to use a
<translate> to move the origin before you do the rotate.
If you translate to the middle of the page, rotate by 90 degrees and then draw the string "hello",
the "hello" will appear starting in the middle of the page going upwards.
Examples:
This is what a <rotate> looks like with degrees set to 45 and -45:
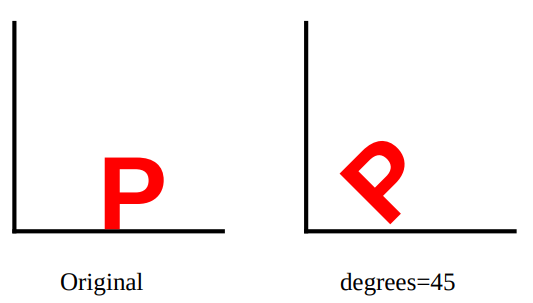
Figure 20: A rotate with a positive value for degrees
<illustration width="256" height="152">
<lineMode width="2" cap="square"/>
<lines>
16 40 116 40
16 40 16 140

156 40 256 40
156 40 156 140
</lines>
<setFont name="Times-Roman" size="12"/>
<fill color="black"/>
<drawCentredString x="58" y="12">Original</drawCentredString>

<setFont name="Helvetica-Bold" size="50"/>
<fill color="red"/>
<drawString x="56" y="41">P</drawString>
<translate dx="142"/>

<setFont name="Times-Roman" size="12"/>
<fill color="black"/>
<drawCentredString x="58" y="12">degrees=45</drawCentredString>

<setFont name="Helvetica-Bold" size="50"/>

<fill color="red"/>
<stroke color="black"/>
<translate dx="52" dy="41"/>
<fill color="red"/>
<setFont name="Helvetica-Bold" size="50"/>
<rotate degrees="45"/>
<drawString x="0" y="0">P</drawString>
</illustration>
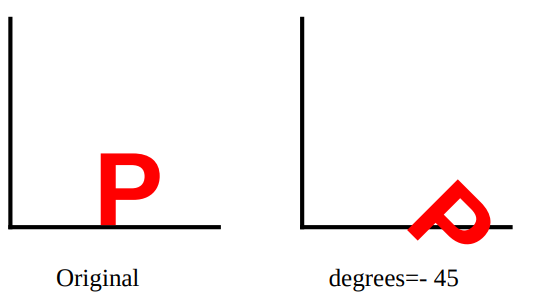
Figure 21: A rotate with a negative value for degrees.
<illustration width="256" height="152">
<lineMode width="2" cap="square"/>
<lines>
16 40 116 40
16 40 16 140

156 40 256 40
156 40 156 140
</lines>
<setFont name="Times-Roman" size="12"/>
<fill color="black"/>
<drawCentredString x="58" y="12">Original</drawCentredString>

<setFont name="Helvetica-Bold" size="50"/>
<fill color="red"/>
<drawString x="56" y="41">P</drawString>
<translate dx="142"/>

<setFont name="Times-Roman" size="12"/>
<fill color="black"/>
<drawCentredString x="58" y="12">degrees=- 45</drawCentredString>

<setFont name="Helvetica-Bold" size="50"/>

<fill color="red"/>
<stroke color="black"/>
<translate dx="62" dy="41"/>
<fill color="red"/>
<setFont name="Helvetica-Bold" size="50"/>
<rotate degrees="-45"/>
<drawString x="0" y="0">P</drawString>
</illustration>
10.7. Skew
<skew> is a transform which distorts both axes of a graphic.
It is non-orthagonal - in other words, it is a transformation that does not preserve right angles.
<skew> has two mandatory attributes: alpha and beta. Both are angles - look at the example
below to see how they work.
Example:
<skew alpha="10" beta="10"/>
This is what a skew with an alpha of 10 and a beta of 30 looks like:
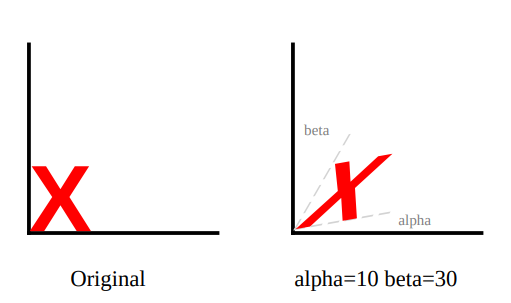
Figure 22: An example of the <skew> tag in use.
<illustration width="256" height="152">
<lineMode width="2" cap="square"/>
<lines>
16 40 116 40
16 40 16 140

156 40 256 40
156 40 156 140
</lines>
<setFont name="Times-Roman" size="12"/>
<fill color="black"/>
<drawCentredString x="58" y="12">Original</drawCentredString>

<setFont name="Helvetica-Bold" size="50"/>
<fill color="red"/>
<drawString x="16" y="41">X</drawString>
<translate dx="142"/>

<setFont name="Times-Roman" size="12"/>
<fill color="black"/>
<drawCentredString x="58" y="12">alpha=10 beta=30</drawCentredString>

<translate dy="42" dx="15"/>
<fill color="gray"/>
<setFont name="Times-Roman" size="8"/>
<drawString x="55" y="2">alpha</drawString>
<drawString x="5" y="50">beta</drawString>

<setFont name="Helvetica-Bold" size="50"/>

<fill color="red"/>
<stroke color="black"/>
<skew alpha="10" beta="30"/>
<lineMode width="1" dash="5,4"/>
<stroke color="lightgrey"/>
<lines>
0 0 0 50
0 0 50 0
</lines>
<drawString x="0" y="0">X</drawString>

</illustration>
10.8. Generic affine transforms
A transform allows the coordinate space to be filtered through a general two dimensional affine transform. All the other coordinate transformations can be defined in terms of a transform. A transform requires 6 numbers a, b, c, d, e, and f to define the transformation.
x' = ax + cy + e
y' = bx + dy + f
For example to specify a=1, b=1.2, c=1.3, d=1.4, e=1.5 and f=1.6 write
10.9. About scale, rotate, and skew
-
It is very easy to move objects "off the page". If you are doing a
<translate>as a<pageGraphic>, it is possible to put the origin off the visible area of the page. If you are doing a<translate>in an<illustration>, no checks are performed about whether an object is inside the limits of the<illustration>or not, so it is still possible to put it outside the limits of the page and lose it. If you expect to see a diagram and all you get is a blank page, this is the most common cause. -
Scaling has its own version of the same problem. It is possible to
<scale>an object so that most or all of it is off the page, but it is also possible to<scale>something to such a small size that it "shrinks to nothing". Be especially careful when doing scaling with large factors. Something that may have been a small error without the scaling may put your object off the page entirely once you have performed the<scale>. -
The scaling operation scales everything - including line widths. If you are taking a huge diagram and scaling it down, the lines may be scaled out of existence. Conversely, if you take something microscopic and enlarge it, you may end up just getting a blob due to the width of the lines being scaled up as well.
-
Another thing to remember is that these transformations are incremental - in a series of transforms, each one will modify the output of the one before it. So the order you carry the operations out in is very important. The result of the sequence "
translate,rotate,scale" is very different to that of "scale,rotate,translate". -
If performing multiple operations, use the order "
translate->rotate->scaleorskew" whenever possible. Using a different order may result in the axes being distorted or other results that lead to an ugly output that isn't what you were trying to do.
10.10. Bitmapped images
RML also allows you to insert pre-existing images into your PDF files. If you have a graphic file
in either the .gif or .jpg format, you can use the <image> tag to
insert it into your document.
The <image> tag goes in the <pageGraphics> section at the
head of your RML document. It has 5 attributes, 3 of which are mandatory and two of which are optional.
The file attribute tells rml2pdf the name of the input file that you want to incorporate into your
document, the x and y attributes give the co-ordinates for the bottom left hand corner of
where the image will be placed on the page. The optional width and height attributes allow you
to specify how big it should be on the page - this means that you can over-ride the normal size of
the file and display it at any size that is appropriate. (The x, y, width and height
attributes can all be gives in points, mm, cm or inches).
Be very careful when using the width and height attributes. If misused, these attributes can
lead to you having a distorted, ugly and out of proportion picture in your final document. Whenever
possible, you should use a paint application (e.g. Paintshop Pro, Photoshop, Graphics Converter, GIMP)
to save the file at the correct size, and use the correct width and height attributes in the
<image> tag. Using larger files and re-sizing inside RML will also lead to the output PDF file
being bloated and larger than it needs to be.
This example shows how these tags look in action:
<pageGraphics>
    <image file="myFile.gif" x="72" y="72"/>
    <image file="myFile.gif" x="369" y="72" width="80" height="80"/>
    <image file="myFile2.jpg" x="72" y="493"/>
    <image file="myFile2.jpg" x="369" y="493" width="80" height="80"/>
</pageGraphics>
10.11. Text Fields
To allow the creation of forms we have a graphics tag that allows us to specify that the page should display an entry box.
The
<textField> tag goes in the
<pageGraphics> section at the at the start of the RML document.
It has the following optional attributes:
id(the field name)value(the field initial value)x(the field x coordinate)y(the field y coordinate)width(the field width)height(the field height)maxlen(maximum allowed number of field characters)multiline(whether the field may contain more than one line)
As a convenience the attributes may instead be specified using <param>
tags within the body of the <textField> tag. The name attribute of the <param> tag should be
one of the above attribute names. If no value attribute or <param> is seen then the contents of
the <textField> becomes the initial value of the field.
10.12. place, illustration & graphicsMode
place
We have seen how graphics and flowables do not mix in RML. The only exceptions
to this are the <place> tag, and the
<illustration> tag. <place>
allows you to put a flowable inside a pageGraphic or
illustration. You can include a paragraph inside a
grid, or a table inside a path.
<place> takes 4 attributes, all of which are required. x, and y are the x and y
co-ordinates for where you want the flowable placed. width and height are the width
and height of the flowable.
Example:
<pageGraphics>
    <place x="10.5cm" y="10.5cm" width="9cm" height="9cm">
        <para>Your flowables would go here.</para>
    </place>
</pageGraphics>
illustration
You can think of an <illustration> as like one of the illustrations in a book. It is a
"box" of space on the page which can contain any of the graphics that you would normally
expect to find in a <pageGraphics> tag. The position of this box depends purely on its
place in the story, which means that it can appear anywhere on the page depending on the
paragraphs and other flowables around it. This is in contrast to the pageGraphics
which are always placed in a specific place (measured from the origin).
graphicsMode
You can think of a <graphicsMode> tag as an <illustration> without a size.
It allows you to insert arbitrary graphics operations into a story without using up any space. The
<graphicsMode> tag takes an origin attribute which can take the values:
local, frame or page to specify the coordinate origin to be used.
Value local means relative to the position where the <graphicsMode> tag is in the current frame,
frame means relative to the frame it is in and page means relative to the page (ie absolute).
Example:
<illustration width="90" height="90">
    <fill color="red"/>
    <circle x="45" y="45" radius="30" fill="yes"/>
    <setFont name="Times-Roman" size="8"/>
    <drawString x="0" y="0">
        Any graphics could go here.
    </drawString>
</illustration>

<illustration width="345" height="333">
    <image file="images/Example_9b.gif" x="0" y="12"/>
    <setFont name="Times-Bold" size="8"/>
</illustration>
The following example shows the use of both place and illustration:
EXAMPLE 15
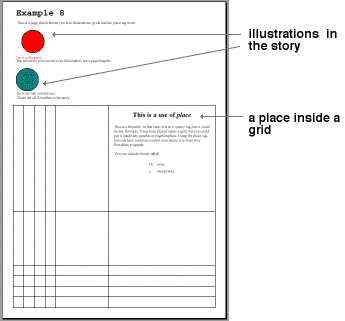
Figure 23: Output from EXAMPLE 15
<?xml version="1.0" encoding="iso-8859-1" standalone="no" ?>
<!DOCTYPE document SYSTEM "rml.dtd">
<document filename="example_9.pdf">
<template>
<pageTemplate id="main">
<pageGraphics>
<grid xs="1cm,2cm,3cm,4cm,5cm,10cm,20cm" ys="1cm,2cm,3cm,4cm,5cm,10cm,20cm"/>
<place x="10.5cm" y="10.5cm" width="9cm" height="9cm">
<title>This is a use of <i>place</i></title>
<spacer length="15"/>
<para>
This is a flowable. In this case, it is in a <para>
tag, but it could be any flowable. It has been placed
inside a grid, but you could put it inside any graphic or
pageGraphics. Using the place tag, you can have complete
control over where you want your flowables to appear.
</para>
<spacer length="12"/>
<para>
You can include Greek: <greek>abgd</greek>.
</para>
<spacer length="12"/>
<blockTable>
<tr>
<td>Or</td><td>even</td>
</tr>
<tr>
<td>a</td><td>blockTable.</td>
</tr>
</blockTable>
</place>
</pageGraphics>
<frame id="first" x1="72" y1="72" width="451" height="698"/>
</pageTemplate>
</template>
<stylesheet>
<paraStyle name="style.Title"
fontName="Courier-Bold"
fontSize="24"
leading="36"
/>
</stylesheet>
<!-- The story starts below this comment -->
<story>
<title>Example 9</title>
<para>
This is a page which shows you how illustrations, grids and the place tag work.
</para>
<illustration width="90" height="90">
<fill color="red"/>
<circle x="45" y="45" radius="30" fill="yes"/>
<setFont name="Times-Roman" size="8"/>
<drawString x="0" y="0">This is an illustration</drawString>
</illustration>
<para>
The red circle you can see is an <i>illustration</i>, not a <i>pageGraphic</i>.
</para>
<illustration width="75" height="75">
<fill color="teal"/>
<circle x="30" y="30" radius="30" fill="yes"/>
<stroke color="darkslategray"/>
<grid xs="15,30,45" ys="5,10,15,20,25,30,35,40,45,50"/>
</illustration>
<para>
So is the teal colored one.
</para>
<para>
These are all flowables in the story.
</para>
</story>
</document>
Notice the symmetry: the <place> tag lets you use flowables within a <pageGraphic>;
the <illustration> tag lets you do graphics operations in a box within the flow of the
<story> (or any story-like context such as a table cell).
10.13. spacer
<spacer> is another tag which does just what the name suggests. A
<spacer> inserts an empty element into the page to force other elements downwards or sideways.
The spacer tag has two attributes - length is mandatory and refers to the length down the page,
and width is optional.
Example:
To produce a spacer 15 points in height and one inch wide, you could do the following:
<spacer length="15" width="72"/>
10.14. Form and doForm
A <form> is a group of graphical operations,
stored together and given a name. This allows you to group complex graphics
together and to re-use them in more than one place with ease.
To do this, you would use the <doForm> tag.
Your form would appear in the pageGraphics section of your RML
document (inside the pageTemplate).
<doForm> also appears in the pageGraphics section.
The <form> tag has one attribute - a mandatory one called name which identifies the form.
The <doForm> tag executes the sequence of graphical operations defined with a <form> tag.
It also has only one mandatory attribute called name.
Example:
<pageGraphics>
    <form name="myForm">
        <drawString x="0" y="24">
            Your graphic operations would go here.
        </drawString>
        <drawString x="0" y="12">
            There would probably be a lot of them to make up something useful.
        </drawString>
    </form>
    <doForm name="myForm"/>
</pageGraphics>
10.15. Why use forms?
Why use forms when you can just cut and paste big chunks of text inside
your RML document with your favorite text editor or word processor?
The benefits are dramatically cut file sizes, reduced production time and apparently even speeding things up on the printer. If you are going to be using PDF files in any situation where people will be downloading them, massively reduced file sizes will be appreciated by your users. These advantages become even more obvious with multiple similar documents. If you are dealing with a run of 5000 repetitive forms - perhaps payslips or single-page invoices - you only need to store the backdrop once and simply draw the changing text on each page.
forms should be used whenever you have a graphic that is used repeatedly. It may be
something as small as your company logo or some sort of symbol you want to flag interesting bits of text with,
or something as large as a whole page backdrop. As long as you use it repeatedly, it's worth using a
form to do it.
forms don't even have to be created in RML. You can use another application
(such as Adobe Illustrator or Word) and distil the output to PDF. You can then
use our PageCatcher product to generate the forms, which can then be used
from RML.
Look on our web site for more information on pageCatcher