Invoice - json to pdf
Getting Started
Register And Install An Evaluation Copy Of Reportlab Plus
This tutorial is aimed at showing the use of Report Markup Language (RML), which is a component of our commercial tool-kit. Here you can get a basic introduction to a common application architecture and start experimenting with some fundamental ReportLab technologies. If you have any problems or questions, please email enquiries@reportlab.com.
This should work with Python 2.7 & >=3.3
All you need to do to download a full evaluation copy is sign in or register on our site; then, follow the installation instructions to get yourself set up. Once these are completed, you're ready to go.
To check that all the dependencies are in place, start Python up (inside your virtual environment, if you are using one) and check these imports all work:
        >>> import reportlab
        >>> import rlextra
Download And Install Tutorial Pack
You have two options, either download the partial tutorial pack, which means you will need to finish to the code changes listed below or download the completed tutorial pack, which means you will not need to make the changes listed below.
Take a look at the directory structure:
data/
output/
rml/
gen_invoice.py
- data/ will hold our JSON data
- rml/ will hold the fonts, images, and templates for constructing the documents
- output/ will hold the generated PDFs
- gen_invoice.py will be the script which ties it all together
Making Your First Document In Report Markup Language
$ python gen_invoice.py data/invoice.json
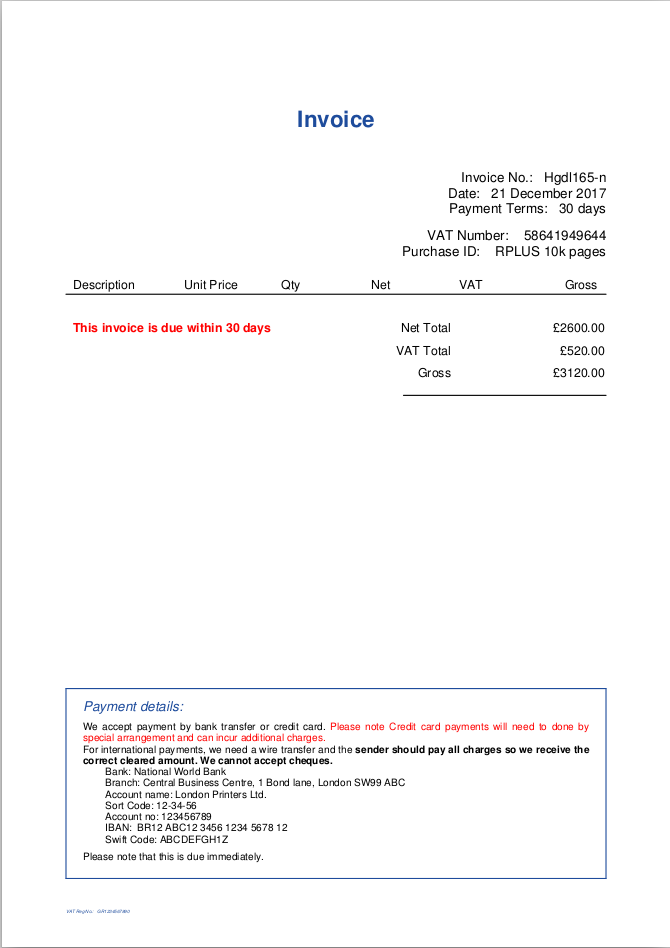
You should now see a file output/invoice.pdf, which should look like:
Code Walk Through
We open and process the JSON data in jsondict.py, which lets us iterate over child nodes and access elements with a dot-notation. The PDF template is rml/invoice.prep, open that file in an editor.
We define the frame(sections) on the page in the pagetemplate tag. During development, setting showBoundary can help be a visual guide to getting frames in the right place. Change the value from 0 to 1
<template pageSize="(595, 842)" leftMargin="0" rightMargin="0" showBoundary="0">
Now generate the PDF again & you should see the the outline of the frames. Change showBoundary back to 0.
In the rlextra package, we can include other PDFs, so if you have stock PDF assests/templates already, we can draw over the top of them. We can achive this in a pageGraphics tags. Here we specify the path and dimensions of the PDF, add this at line 8:
<image file="/rml/rl_letterhead_201203.pdf" x="0" y="0" width="595" height="842"/>
Now generate to PDF again.
We can add some further enhancements to the style & make it a bit more colourful. In the stylesheet we can change the style. Now we add a blue background with white text:
```
<!-- top row centered, bold and white on blue-->
<blockAlignment value="center" start="0,0" stop="-1,0"/>
<blockBackground colorName="#1E4C9C" start="0,0" stop="-1,0"/>
<blockFont name="Helvetica-Bold" size="11" leading="15" start="0,0" stop="-1,0"/>
<blockTextColor colorName="white" start="0,0" stop="-1,0"/>
```
We can define styles in the stylesheet tags, including paragraph styles: We can use the dot notation that jsondict.py allows.
<para style="normal" leading="20" fontSize="17"> <b> {{ data.customer_name }} </b> <br/> </para>
<pre style="normal"> {{data.address }} </pre>
<para style="normal" leading="20"> {{data.country_name }} </para>
<para style="normal"> <i>Requested by: </i> <br/>{{data.manager }} </para>
In the template we can use a for loop to display the order:
{{ for item in data.orders }}
        <tr>
            <td> <para style="table_normal">{{item.description}}</para> </td>
            <td align="DECIMAL" rightPadding="20" vAlign="top">{{item.price}}}</td>
            <td align="CENTER" vAlign="top">{{item.quantity}}</td>
            <td align="DECIMAL" rightPadding="20" vAlign="top">{{item.net}}</td>
            <td align="CENTER" vAlign="top">{{item.vat}}</td>
            <td align="DECIMAL" rightPadding="15" vAlign="top">{{item.gross}}</td>
        </tr>
{{ endfor }}
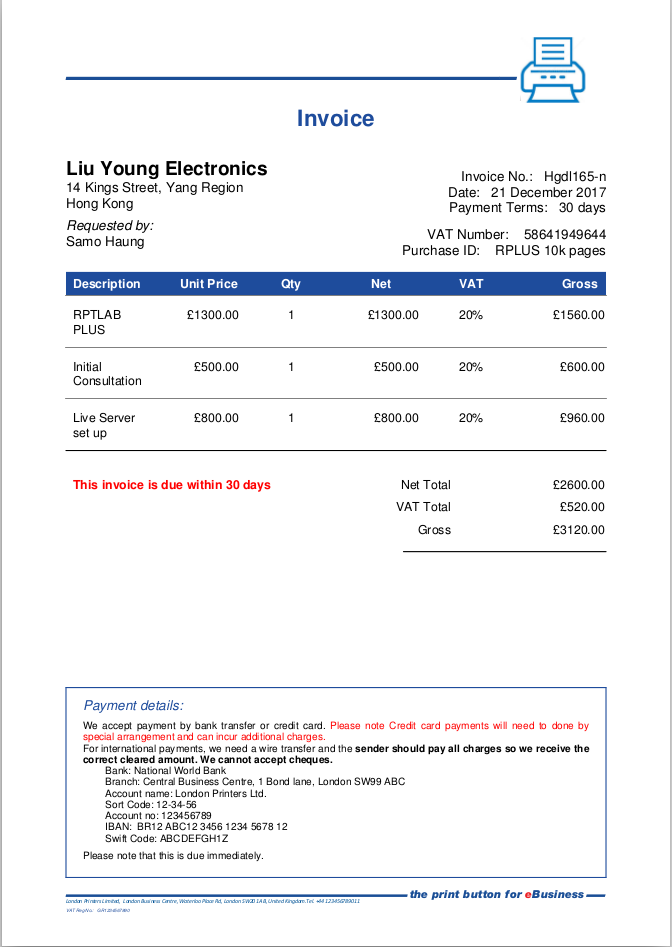
Now generate the PDF again. The ouput should look like this:
Finally, a crude example of including Python code directly in the template. The script tag allows us to embed Python code. Lets say we plan to double check that the totals in the data match a computed value:
{{script}}
from decimal import Decimal
def verify_totals(data,total_price):
    """
    crude example of script within a template
    check that the gross total in the JSON agrees with the computed total
    """
    verified = False
    calculated_total_price = Decimal(0.0)
    allowed_margin = 0.01
    for item in data:
            net = Decimal(item.price[1:]) * Decimal(item.quantity)
            calculated_total_price += net + (net * (Decimal(item.vat[:-1])/100))
    if abs(calculated_total_price - Decimal(total_price[1:])) < allowed_margin:
        verified=True
    return verified
{{endscript}}
We can now add a call verify_totals() & print an error if accordingly. However, rather than display a warning on the PDF itself, a better approach might be to call any data validation code alot ealier & raise an error so that the PDF does not get generated.
<td align="RIGHT">
{{if not verify_totals(data.orders,data.total_price}}
<para style="table_normal" textColor="red"> <b> !!! ERROR !!! - computed total does not match data source </b></para>
{{endif}}
</td>
Now look at line 21 in data/invoice.json change
"price": "£1300.00",
to:
"price": "£1000.00",
Now save data.json and re-run the script and check the output.
Further examples of the huge range of chart types available with ReportLab can be found in our chart gallery which included details of the main parameters of each style. Go and experiment!