Tables and TableStyles
The Table and LongTable classes derive from the Flowable class and are intended
as a simple textual gridding mechanisms. The longTable class uses a greedy algorithm
when calculating column widths and is intended for long tables where speed counts.
Table cells can hold anything which can be converted to
a Python string or Flowables (or lists of Flowables).
Our present tables are a trade-off between efficient drawing and specification and functionality. We assume the reader has some familiarity with HTML tables. In brief, they have the following characteristics:
-
They can contain anything convertible to a string; flowable objects such as other tables; or entire sub-stories
-
They can work out the row heights to fit the data if you don't supply the row height. (They can also work out the widths, but generally it is better for a designer to set the width manually, and it draws faster).
-
They can split across pages if needed (see the canSplit attribute). You can specify that a number of rows at the top and bottom should be repeated after the split (e.g. show the headers again on page 2,3,4...)
-
They have a simple and powerful notation for specifying shading and gridlines which works well with financial or database tables, where you don't know the number of rows up front. You can easily say 'make the last row bold and put a line above it'
-
The style and data are separated, so you can declare a handful of table styles and use them for a family of reports. Styes can also 'inherit', as with paragraphs.
There is however one main limitation compared to an HTML table. They define a simple rectangular grid. There is no simple row or column spanning; if you need to span cells, you must nest tables inside table cells instead or use a more complex scheme in which the lead cell of a span contains the actual contents.
Tables are created by passing the constructor an optional sequence of column widths,
an optional sequence of row heights, and the data in row order.
Drawing of the table can be controlled by using a TableStyle instance. This allows control of the
color and weight of the lines (if any), and the font, alignment and padding of the text.
A primitive automatic row height and or column width calculation mechanism is provided for.
Table User Methods
These are the main methods which are of interest to the client programmer.
Table(data, colWidths=None, rowHeights=None, style=None, splitByRow=1, repeatRows=0, repeatCols=0, rowSplitRange=None, spaceBefore=None, spaceAfter=None, cornerRadii=None)
The data argument is a sequence of sequences of cell values each of which
should be convertible to a string value using the str function or should be a Flowable instance (such as a Paragraph) or a list (or tuple) of such instances.
If a cell value is a Flowable or list of Flowables these must either have a determined width
or the containing column must have a fixed width.
The first row of cell values
is in data[0] i.e. the values are in row order. The i, jth. cell value is in
data[i][j]. Newline characters '\\n' in cell values are treated as line split characters and
are used at draw time to format the cell into lines.
The other arguments are fairly obvious, the colWidths argument is a sequence
of numbers or possibly None, representing the widths of the columns. The number of elements
in colWidths determines the number of columns in the table.
A value of None means that the corresponding column width should be calculated automatically.
The rowHeights argument is a sequence
of numbers or possibly None, representing the heights of the rows. The number of elements
in rowHeights determines the number of rows in the table.
A value of None means that the corresponding row height should be calculated automatically.
The style argument can be an initial style for the table.
The splitByRow argument is only needed for tables both too tall and too wide
to fit in the current context. In this case you must decide whether to 'tile'
down and across, or across and then down. This parameter is a Boolean indicating that the
Table should split itself
by row before attempting to split itself by column when too little space is available in
the current drawing area and the caller wants the Table to split.
Splitting a Table by column is currently not implemented, so setting splitByRow to False will result in a NotImplementedError.
The repeatRows argument specifies the number or a tuple of leading rows
that should be repeated when the Table is asked to split itself. If it is a tuple it should specify which of the leading rows should be repeated; this allows
for cases where the first appearance of the table hsa more leading rows than later split parts.
The repeatCols argument is currently ignored as a Table cannot be split by column.
The rowSplitRange argument may be used to control the splitting of the table to a subset of its rows; that can be to prevent splitting too close to the beginning or end of the table.
The spaceBefore & spaceAfter arguments may be used to put extra space before or after the table when renedered in a platypus story.
The style argument can be an initial style for the table.
The cornerRadii argument can be a list of the top left, top right, bottom left and bottom right radii.
A positive non-zero radius indicates that the corner should be rounded. This argument will override any ROUNDEDCORNERS command in the argument style list (ie it has pririty).
Table.setStyle(tblStyle)
This method applies a particular instance of class TableStyle (discussed below)
to the Table instance. This is the only way to get tables to appear
in a nicely formatted way.
Successive uses of the setStyle method apply the styles in an additive fashion.
That is, later applications override earlier ones where they overlap.
TableStyle
This class is created by passing it a sequence of commands, each command is a tuple identified by its first element which is a string; the remaining elements of the command tuple represent the start and stop cell coordinates of the command and possibly thickness and colors, etc.
TableStyle User Methods
TableStyle(commandSequence)
The creation method initializes the TableStyle with the argument
command sequence as an example:
LIST_STYLE = TableStyle(
    [('LINEABOVE', (0,0), (-1,0), 2, colors.green),
    ('LINEABOVE', (0,1), (-1,-1), 0.25, colors.black),
    ('LINEBELOW', (0,-1), (-1,-1), 2, colors.green),
    ('ALIGN', (1,1), (-1,-1), 'RIGHT')]
    )
TableStyle.add(commandSequence)
This method allows you to add commands to an existing
TableStyle, i.e. you can build up TableStyles in multiple statements.
LIST_STYLE.add('BACKGROUND', (0,0), (-1,0), colors.Color(0,0.7,0.7))
TableStyle.getCommands()
This method returns the sequence of commands of the instance.
cmds = LIST_STYLE.getCommands()
TableStyle Commands
The commands passed to TableStyles come in three main groups
which affect the table background, draw lines, or set cell styles.
The first element of each command is its identifier, the second and third arguments determine the cell coordinates of the box of cells which are affected with negative coordinates counting backwards from the limit values as in Python indexing. The coordinates are given as (column, row) which follows the spreadsheet 'A1' model, but not the more natural (for mathematicians) 'RC' ordering. The top left cell is (0, 0) the bottom right is (-1, -1). Depending on the command various extra (???) occur at indices beginning at 3 on.
TableStyle Cell Formatting Commands
The cell formatting commands all begin with an identifier, followed by the start and stop cell definitions and the perhaps other arguments. the cell formatting commands are:
FONT                    - takes fontname, optional fontsize and optional leading.
FONTNAME (or FACE)      - takes fontname.
FONTSIZE (or SIZE)      - takes fontsize in points; leading may get out of sync.
LEADING                 - takes leading in points.
TEXTCOLOR               - takes a color name or (R,G,B) tuple.
ALIGNMENT (or ALIGN)    - takes one of LEFT, RIGHT and CENTRE (or CENTER) or DECIMAL.
LEFTPADDING             - takes an integer, defaults to 6.
RIGHTPADDING            - takes an integer, defaults to 6.
BOTTOMPADDING           - takes an integer, defaults to 3.
TOPPADDING              - takes an integer, defaults to 3.
BACKGROUND              - takes a color defined by an object, string name or numeric tuple/list,
                          or takes a list/tuple describing a desired gradient fill which should
                          contain three elements of the form [DIRECTION, startColor, endColor]
                          where DIRECTION is either VERTICAL or HORIZONTAL.
ROWBACKGROUNDS          - takes a list of colors to be used cyclically.
COLBACKGROUNDS          - takes a list of colors to be used cyclically.
VALIGN                  - takes one of TOP, MIDDLE or the default BOTTOM
This sets the background cell color in the relevant cells.
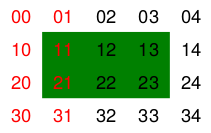
The following example shows the BACKGROUND, and TEXTCOLOR commands in action:
data=  [['00', '01', '02', '03', '04'],
        ['10', '11', '12', '13', '14'],
        ['20', '21', '22', '23', '24'],
        ['30', '31', '32', '33', '34']]
t=Table(data)
t.setStyle(TableStyle([('BACKGROUND',(1,1),(-2,-2),colors.green),
                        ('TEXTCOLOR',(0,0),(1,-1),colors.red)]))
Which produces
To see the effects of the alignment styles we need some widths and a grid, but it should be easy to see where the styles come from.
    data=  [['00', '01', '02', '03', '04'],
            ['10', '11', '12', '13', '14'],
            ['20', '21', '22', '23', '24'],
            ['30', '31', '32', '33', '34']]
    t=Table(data,5*[0.4*inch], 4*[0.4*inch])
    t.setStyle(TableStyle([('ALIGN',(1,1),(-2,-2),'RIGHT'),
                            ('TEXTCOLOR',(1,1),(-2,-2),colors.red),
                            ('VALIGN',(0,0),(0,-1),'TOP'),
                            ('TEXTCOLOR',(0,0),(0,-1),colors.blue),
                            ('ALIGN',(0,-1),(-1,-1),'CENTER'),
                            ('VALIGN',(0,-1),(-1,-1),'MIDDLE'),
                            ('TEXTCOLOR',(0,-1),(-1,-1),colors.green),
                            ('INNERGRID', (0,0), (-1,-1), 0.25, colors.black),
                            ('BOX', (0,0), (-1,-1), 0.25, colors.black),
                            ]))
TableStyle Line Commands
Line commands begin with the identifier, the start and stop cell coordinates
and always follow this with the thickness (in points) and color of the desired lines. Colors can be names,
or they can be specified as a (R, G, B) tuple, where R, G and B are floats and (0, 0, 0) is black. The line
command names are: GRID, BOX, OUTLINE, INNERGRID, LINEBELOW, LINEABOVE, LINEBEFORE
and LINEAFTER. BOX and OUTLINE are equivalent, and GRID is the equivalent of applying both BOX and
INNERGRID.
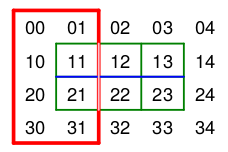
We can see some line commands in action with the following example.
    data=  [['00', '01', '02', '03', '04'],
            ['10', '11', '12', '13', '14'],
            ['20', '21', '22', '23', '24'],
            ['30', '31', '32', '33', '34']]
    t=Table(data,style=[('GRID',(1,1),(-2,-2),1,colors.green),
                        ('BOX',(0,0),(1,-1),2,colors.red),
                        ('LINEABOVE',(1,2),(-2,2),1,colors.blue),
                        ('LINEBEFORE',(2,1),(2,-2),1,colors.pink),
                        ])
Which produces
Line commands cause problems for tables when they split; the following example shows a table being split in various positions
    data=  [['00', '01', '02', '03', '04'],
            ['10', '11', '12', '13', '14'],
            ['20', '21', '22', '23', '24'],
            ['30', '31', '32', '33', '34']]
    t=Table(data,style=[
                    ('GRID',(0,0),(-1,-1),0.5,colors.grey),
                    ('GRID',(1,1),(-2,-2),1,colors.green),
                    ('BOX',(0,0),(1,-1),2,colors.red),
                    ('BOX',(0,0),(-1,-1),2,colors.black),
                    ('LINEABOVE',(1,2),(-2,2),1,colors.blue),
                    ('LINEBEFORE',(2,1),(2,-2),1,colors.pink),
                    ('BACKGROUND', (0, 0), (0, 1), colors.pink),
                    ('BACKGROUND', (1, 1), (1, 2), colors.lavender),
                    ('BACKGROUND', (2, 2), (2, 3), colors.orange),
                    ])
When unsplit and split at the first or second row.
Complex Cell Values
As mentioned above we can have complicated cell values including Paragraphs, Images and other Flowables
or lists of the same. To see this in operation consider the following code and the table it produces.
Note that the Image has a white background which will obscure any background you choose for the cell.
To get better results you should use a transparent background.
from reportlab.platypus import Paragraph,Image,Table
from reportlab.lib.units import inch
from reportlab.lib.styles import getSampleStyleSheet
from reportlab.lib import colors

styleSheet=getSampleStyleSheet()
I = Image('https://docs.reportlab.com/graphics/co2.png')
I.drawHeight = 1.25*inch*I.drawHeight / I.drawWidth
I.drawWidth = 1.25*inch
P0 = Paragraph('''
                <b>A pa<font color=red>r</font>a<i>graph</i></b>
                <super><font color=yellow>1</font></super>''',
                styleSheet["BodyText"])

P = Paragraph('''
                <para align=center spaceb=3>The <b>ReportLab Left
                <font color=red>Logo</font></b>
                Image</para>''',
                styleSheet["BodyText"])
                data= [['A', 'B', 'C', P0, 'D'],
                ['00', '01', '02', [I,P], '04'],
                ['10', '11', '12', [P,I], '14'],
                ['20', '21', '22', '23', '24'],
                ['30', '31', '32', '33', '34']]

t=Table(data,style=[('GRID',(1,1),(-2,-2),1,colors.green),
                ('BOX',(0,0),(1,-1),2,colors.red),
                ('LINEABOVE',(1,2),(-2,2),1,colors.blue),
                ('LINEBEFORE',(2,1),(2,-2),1,colors.pink),
                ('BACKGROUND', (0, 0), (0, 1), colors.pink),
                ('BACKGROUND', (1, 1), (1, 2), colors.lavender),
                ('BACKGROUND', (2, 2), (2, 3), colors.orange),
                ('BOX',(0,0),(-1,-1),2,colors.black),
                ('GRID',(0,0),(-1,-1),0.5,colors.black),
                ('VALIGN',(3,0),(3,0),'BOTTOM'),
                ('BACKGROUND',(3,0),(3,0),colors.limegreen),
                ('BACKGROUND',(3,1),(3,1),colors.khaki),
                ('ALIGN',(3,1),(3,1),'CENTER'),
                ('BACKGROUND',(3,2),(3,2),colors.beige),
                ('ALIGN',(3,2),(3,2),'LEFT'),
                ])
t._argW[3]=1.5*inch
Image required
TableStyle Span Commands
Our Table classes support the concept of spanning, but it isn't specified in the same way
as html. The style specification
SPAN, (sc,sr), (ec,er)
indicates that the cells in columns sc - ec and rows sr - er should be combined into a super cell
with contents determined by the cell (sc, sr). The other cells should be present, but should contain empty strings
or you may get unexpected results.
data= [['Top\nLeft', '', '02', '03', '04'],
            ['', '', '12', '13', '14'],
            ['20', '21', '22', 'Bottom\nRight', ''],
            ['30', '31', '32', '', '']]

t=Table(data,style=[
        ('GRID',(0,0),(-1,-1),0.5,colors.grey),
        ('BACKGROUND',(0,0),(1,1),colors.palegreen),
        ('SPAN',(0,0),(1,1)),
        ('BACKGROUND',(-2,-2),(-1,-1), colors.pink),
        ('SPAN',(-2,-2),(-1,-1)),
        ])
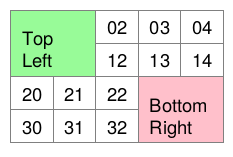
notice that we don't need to be conservative with our GRID command. The spanned cells are not drawn through.
TableStyle Miscellaneous Commands
To control Table splitting the NOSPLIT command may be used
The style specification
NOSPLIT, (sc,sr), (ec,er)
demands that the cells in columns sc - ec and rows sr - er may not be split.
To control Table corner rounding the ROUNDEDCORNERS command may be used
The style specification
ROUNDEDCORNERS, [tl, tr, bl, br]
specifies the radii of the top left, top right, bottom left and bottom right. A value of 0 indicates a square corner. replace the whole array by None to turn off all rounding.
Borders at a rounded corner are curved by an octant.
Special TableStyle Indeces
In any style command the first row index may be set to one of the special strings
'splitlast' or 'splitfirst' to indicate that the style should be used only for the last row of
a split table, or the first row of a continuation. This allows splitting tables with nicer effects around the split.