Calling Card
In this demo we use the Open Source reportlab package to make a calling card:

Installation
As always, we recommend a virtual environment when installing python packages. For this tutorial we will be making bitmaps so we should install the optional dependency of pycairo with the opensource ReportLab:
python3.10 -m venv rptlab
source rptlab/bin/activate
pip install "reportlab[pycairo]"
An empty card
The first thing we need to do is make an empty card, we can do this by using the Drawing class in reportlab.graphics.shapes:
from reportlab.graphics.shapes import Drawing

drawing = Drawing(400, 200)
# save
drawing.save(formats=['pdf', 'png'], outDir=".", fnRoot="card")
This will create an white card of 400x200 pixels.
Beige Rectangle
A white card isn't that interesting for a calling card so we will add a beige rectangle of the same size on top of the Drawing:
from reportlab.lib import colors
from reportlab.graphics.shapes import Drawing, Rect

drawing = Drawing(400, 200)
# beige rectangle
r1 = Rect(0, 0, 400, 200, 0, 0)
r1.fillColor = colors.beige
drawing.add(r1)
# save
drawing.save(formats=['pdf', 'png'], outDir=".", fnRoot="card")

Font
One of the toughest choice all graphic designers make! We can register any font we have locally, in this demo we can use the MacOS's fonts locally stored and register them in ReportLab.
from reportlab.lib import colors
from reportlab.graphics.shapes import Drawing, Rect
from reportlab.pdfbase.pdfmetrics import registerFont
from reportlab.pdfbase.ttfonts import TTFont

# font
registerFont(TTFont("Times", "/System/Library/Fonts/Times.ttc"))

drawing = Drawing(400, 200)
# beige rectangle
r1 = Rect(0, 0, 400, 200, 0, 0)
r1.fillColor = colors.beige
drawing.add(r1)
# save
drawing.save(formats=['pdf', 'png'], outDir=".", fnRoot="card")
Company Logo
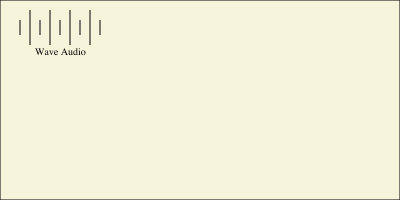
Our fake company will be an audio company, for this we thought it would be fun to make a sine wave by using some straight lines of different sizes. ReportLab offers the ability to Group together shapes, so let's group together multiple Line objects so that they look like a wave and give our company a name:
(we can use the translate utililty to move the group around the drawing)
from reportlab.lib import colors
from reportlab.graphics.shapes import (Drawing, Rect, String, Line, Group)
from reportlab.pdfbase.pdfmetrics import registerFont
from reportlab.pdfbase.ttfonts import TTFont

# font
registerFont(TTFont("Times", "/System/Library/Fonts/Times.ttc"))

drawing = Drawing(400, 200)
# beige rectangle
r1 = Rect(0, 0, 400, 200, 0, 0)
r1.fillColor = colors.beige
drawing.add(r1)

# logo
wave = Group(
    Line(10, -5, 10, 10),
    Line(20, -15, 20, 20),
    Line(30, -5, 30, 10),
    Line(40, -15, 40, 20),
    Line(50, -5, 50, 10),
    Line(60, -15, 60, 20),
    Line(70, -5, 70, 10),
    Line(80, -15, 80, 20),
    Line(90, -5, 90, 10),
    String(25, -25, "Wave Audio", fontName='Times')
)
wave.translate(10, 170)
drawing.add(wave)

# save
drawing.save(formats=['pdf', 'png'], outDir=".", fnRoot="card")

Name
Using the same tactic as above, we will group together some strings to make our name and company role:
from reportlab.lib import colors
from reportlab.graphics.shapes import (Drawing, Rect, String, Line, Group)
from reportlab.pdfbase.pdfmetrics import registerFont
from reportlab.pdfbase.ttfonts import TTFont

# font
registerFont(TTFont("Times", "/System/Library/Fonts/Times.ttc"))

drawing = Drawing(400, 200)
# beige rectangle
r1 = Rect(0, 0, 400, 200, 0, 0)
r1.fillColor = colors.beige
drawing.add(r1)

# logo
wave = Group(
    Line(10, -5, 10, 10),
    Line(20, -15, 20, 20),
    Line(30, -5, 30, 10),
    Line(40, -15, 40, 20),
    Line(50, -5, 50, 10),
    Line(60, -15, 60, 20),
    Line(70, -5, 70, 10),
    Line(80, -15, 80, 20),
    Line(90, -5, 90, 10),
    String(25, -25, "Wave Audio", fontName='Times')
)
wave.translate(10, 170)
drawing.add(wave)

# name
name = Group(
    String(
        0,
        100,
        "Jane Doe",
        textAnchor='middle',
        fontName='Times',
        fontSize=18,
        fillColor=colors.black
    ),
    Line(
        -50,
        85,
        50,
        85,
        strokeColor=colors.grey,
        strokeLineCap=1,
        strokeWidth=2
    ),
    String(
        0,
        60,
        "Audio Specalist",
        textAnchor='middle',
        fontName='Times',
        fontSize=15,
        fillColor=colors.black
    )
)
name.translate(290, 10)
drawing.add(name)

# save
drawing.save(formats=['pdf', 'png'], outDir=".", fnRoot="card")

Contact details
Once again let's add another group, this time for contact details:
from reportlab.lib import colors
from reportlab.graphics.shapes import (Drawing, Rect, String, Line, Group)
from reportlab.pdfbase.pdfmetrics import registerFont
from reportlab.pdfbase.ttfonts import TTFont

# font
registerFont(TTFont("Times", "/System/Library/Fonts/Times.ttc"))

drawing = Drawing(400, 200)
# beige rectangle
r1 = Rect(0, 0, 400, 200, 0, 0)
r1.fillColor = colors.beige
drawing.add(r1)

# logo
wave = Group(
    Line(10, -5, 10, 10),
    Line(20, -15, 20, 20),
    Line(30, -5, 30, 10),
    Line(40, -15, 40, 20),
    Line(50, -5, 50, 10),
    Line(60, -15, 60, 20),
    Line(70, -5, 70, 10),
    Line(80, -15, 80, 20),
    Line(90, -5, 90, 10),
    String(25, -25, "Wave Audio", fontName='Times')
)
wave.translate(10, 170)
drawing.add(wave)

# name
name = Group(
    String(
        0,
        100,
        "Jane Doe",
        textAnchor='middle',
        fontName='Times',
        fontSize=18,
        fillColor=colors.black
    ),
    Line(
        -50,
        85,
        50,
        85,
        strokeColor=colors.grey,
        strokeLineCap=1,
        strokeWidth=2
    ),
    String(
        0,
        60,
        "Audio Specalist",
        textAnchor='middle',
        fontName='Times',
        fontSize=15,
        fillColor=colors.black
    )
)
name.translate(290, 10)
drawing.add(name)

# contact info
info = Group(
    String(
        0,
        30,
        "T: +447777777777",
        fontName='Times',
        fontSize=10,
        fillColor=colors.black
    ),
    String(
        0,
        20,
        "E: jane@audio.com",
        fontName='Times',
        fontSize=10,
        fillColor=colors.black
    ),
    String(
        0,
        10,
        "www.waveaudio.com",
        fontName='Times',
        fontSize=10,
        fillColor=colors.black
    )
)
info.translate(20, 10)
drawing.add(info)

# save
drawing.save(formats=['pdf', 'png'], outDir=".", fnRoot="card")

Mass production
That's it! We've made a calling card using using ReportLab... but why stop at just Jane Doe, why not the whole company! Let's make a business card for 100 people!
To do this we will make a list of 100 fake names using randat, we will save this locally and call it names.csv.
Now all we need to do is put the code above into a function with args for first and last name:
import csv
from reportlab.lib import colors
from reportlab.graphics.shapes import (Drawing, Rect, String, Line, Group)
from reportlab.pdfbase.pdfmetrics import registerFont
from reportlab.pdfbase.ttfonts import TTFont
import time

# font
registerFont(TTFont("Times", "/System/Library/Fonts/Times.ttc"))


def card(fName, lName):
    drawing = Drawing(400, 200)
    r1 = Rect(0, 0, 400, 200, 0, 0)
    r1.fillColor = colors.beige
    drawing.add(r1)

    wave = Group(
        Line(10, -5, 10, 10),
        Line(20, -15, 20, 20),
        Line(30, -5, 30, 10),
        Line(40, -15, 40, 20),
        Line(50, -5, 50, 10),
        Line(60, -15, 60, 20),
        Line(70, -5, 70, 10),
        Line(80, -15, 80, 20),
        Line(90, -5, 90, 10),
        String(25, -25, "Wave Audio", fontName='Times')
    )

    wave.translate(10, 170)
    drawing.add(wave)

    name = Group(
        String(
            0,
            100,
            "%s %s" % (fName, lName),
            textAnchor='middle',
            fontName='Times',
            fontSize=18,
            fillColor=colors.black
        ),
        Line(
            -50,
            85,
            50,
            85,
            strokeColor=colors.grey,
            strokeLineCap=1,
            strokeWidth=2
        ),
        String(
            0,
            60,
            "Audio Specalist",
            textAnchor='middle',
            fontName='Times',
            fontSize=15,
            fillColor=colors.black
        )
    )
    name.translate(290, 10)
    drawing.add(name)

    info = Group(
        String(
            0,
            30,
            "T: +447777777777",
            fontName='Times',
            fontSize=10,
            fillColor=colors.black
        ),
        String(
            0,
            20,
            "E: %s@audio.com" % fName.lower(),
            fontName='Times',
            fontSize=10,
            fillColor=colors.black
        ),
        String(
            0,
            10,
            "www.waveaudio.com",
            fontName='Times',
            fontSize=10,
            fillColor=colors.black
        )
    )
    info.translate(20, 10)
    drawing.add(info)
    return drawing


# from https://docs.python.org/3/library/csv.html
t1 = time.time()
with open('names.csv', newline='') as csvfile:
    reader = csv.DictReader(csvfile)
    for idx, row in enumerate(reader):
        d = card(row['First Name'], row['Last Name'])
        d.save(
            formats=['png'],
            outDir="company/",
            fnRoot="%s-%s" % (row['First Name'], row['Last Name'])
        )
t2 = time.time()
print("That took %f s for %d cards" % ((t2-t1), (idx+1)))
Outputs collated:

So there you have it, a 100 calling cards produced for the company. And it only took about 2 seconds on my machine!