XLS to PDF - Fund Performance Report (In Progress)
Getting Started
This tutorial is aimed at showing the use of Report Markup Language (RML), which is a component of our commercial tool-kit. Here you can get a basic introduction to a common application architecture and start experimenting with some fundamental ReportLab technologies. If you have any problems or questions, please email enquiries@reportlab.com.
This should work with Python >=3
All you need to do to download a full evaluation copy is sign in or register on our site;
Download And Install Tutorial Pack
To pull this down, run this command, (you need to first install mercurial)
hg clone https://hg.reportlab.com/hg-public/rlextra-examples/
then look at the README.
If you are stuck behind a firewall, our Mercurial repo has a link download a zip file
https://hg.reportlab.com/hg-public/rlextra-examples/archive/tip.zip
Install and set up from ReportLab application repository
$ cd xls-to-pdf
$ python -m venv .
$ . bin/activate
$ pip install -r requirements.txt
Code Walk Through
Take a look at the directory structure:
data/
output/
rml/
runme.py.py
investor_company_sectors_pie.py
product_chart.py
utils.py
- data/ will hold the xls file. The first tab conatins performance data for each Fund used to generate the line chart, subsequent tabs contain key facts / sectors / summary / data for each fund.
- rml/ will hold the fonts, images, and templates for constructing the documents.
- output/ will hold the generated PDFs.
- rml/template.prep is where we use RML to define the PDF structure and content.
- runme.py will be the script which ties it all together.
- investor_company_sectors_pie.py - A Pie Chart python module created by our Diagra tool.
- product_chart.py - A complex data aware custom line chart created by our Diagra tool.
- utils.py contains functions used to process the XLS file.
Making Your First Document In Report Markup Language
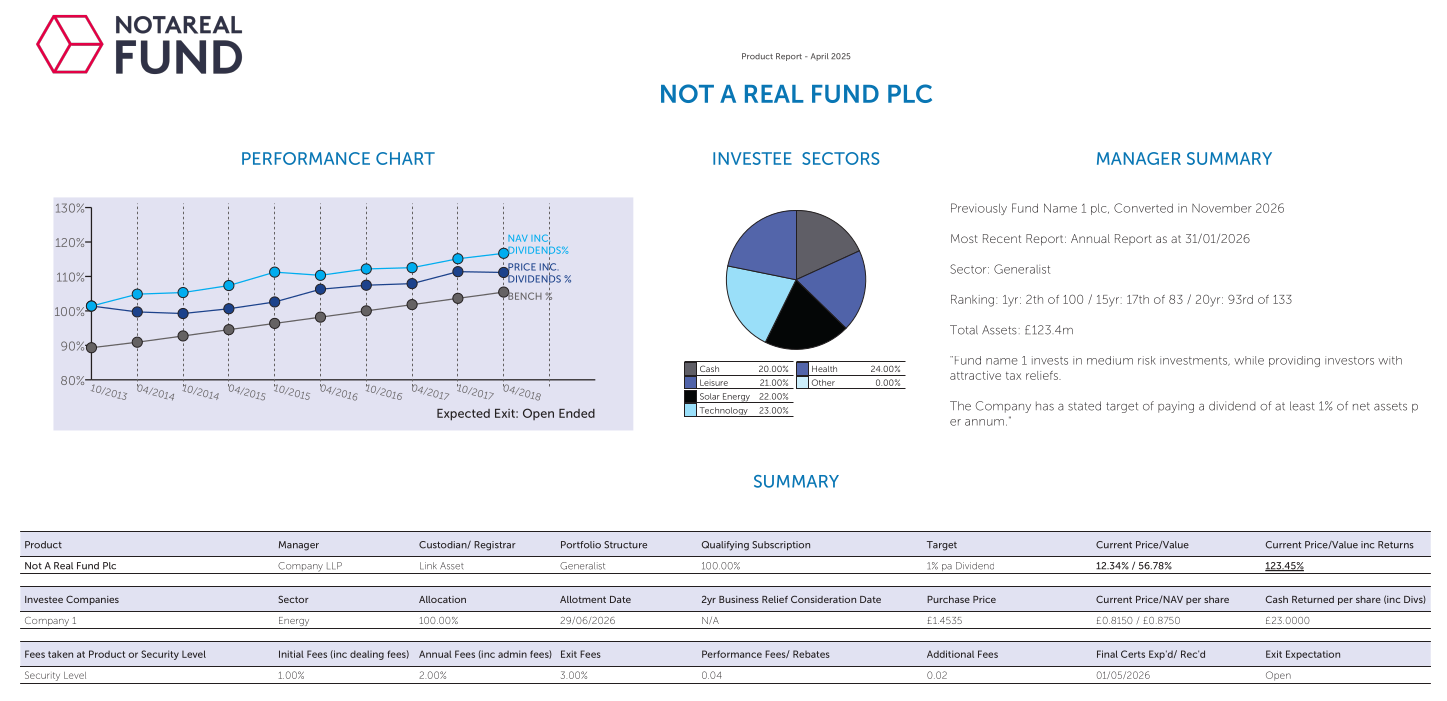
$ python runme.py.py data/data.xls
You should now see a file output/invoice.pdf, which should look like:
Further examples of the huge range of chart types available with ReportLab can be found in our chart gallery.